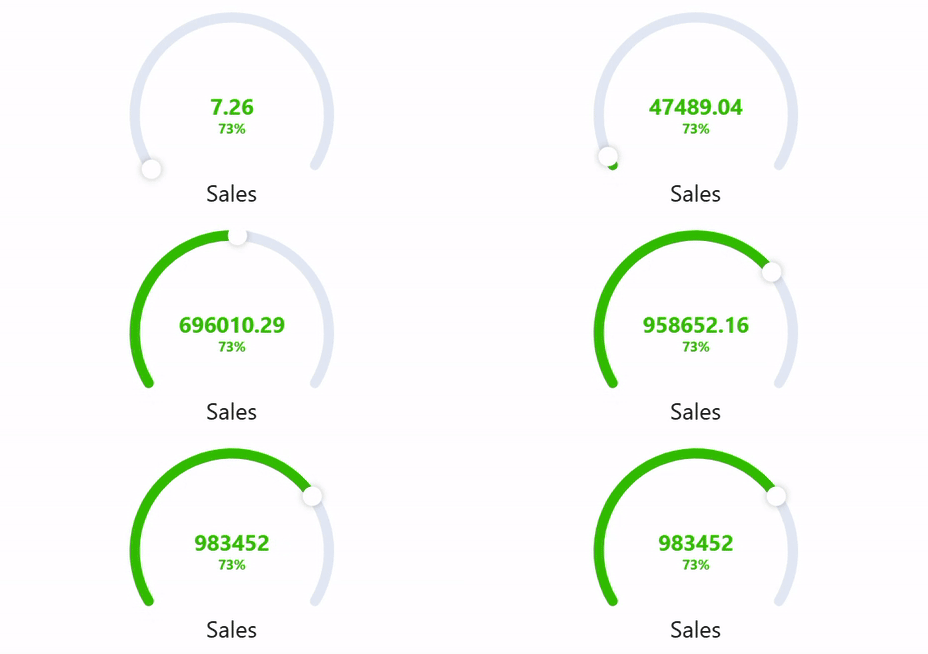
Gauge Chart

Overview
The 'Gauge Chart' Lightning Web Component (LWC) offers a dynamic and interactive visualization tool for displaying performance metrics within Salesforce. This component is designed to represent data in a gauge format, providing users with a clear and intuitive way to assess progress towards a target or threshold. By leveraging the Gauge Chart, users can effectively monitor key performance indicators (KPIs) and make informed decisions based on visual data insights.
How Does It Work?
The Polar Chart displays data as a circular graph, with segments representing different metrics. The chart includes:
- Actual Value: The current value of the metric.
- Target Value: The target objective value to reach 100% of the gauge.
- Title (Optional): A specific title for the chart, providing context to the data being displayed.
- Subtitle (Optional): Additional context or details about the data being displayed.
- Format Pipe (Optional): A function to customize the format of the displayed values (e.g., percentage formatting).
Usage
Setting Up the Flow
To use the Polar Chart, you need to set up a flow in Salesforce that retrieves the necessary data and passes it to the LWC. Here’s how you can do it:
Define the
ResultCollectionVariable:- In the Flow Builder, create a new variable named
ResultCollection. - Set the Data Type to
Text. - Ensure "Allow multiple values (collection)" is checked.
- Mark it as "Available for output" so it can be accessed by the component.
- In the Flow Builder, create a new variable named
Create a Formula Resource:
- Create a new resource of type
Formula. - Set the API Name to something like
LaFormula. - Set the Data Type to
Text. - Use the formula editor to construct your JSON string. For example:
'{"actualValue": "' + TEXT(5) + '", "targetValue": "' + TEXT(10) + '", "title": "Test"}' - This formula constructs a JSON string with the specified values.
- Create a new resource of type
Assign the Formula to
ResultCollection:- Add an
Assignmentelement to your Flow. - Set the
ResultCollectionvariable to the value of the formula resource (LaFormula). - Ensure the operator is set to
Add.
- Add an
Save and Activate the Flow:
- Save your Flow.
- Activate the Flow if it's not already active.
Using Input Queries
Alternatively, you can use input queries to provide data to the Gauge Chart. Here’s how:
Define Input Queries:
- Create a list of input queries as a JSON string. Each query should include a key (reference ID) and a value (SOQL query).
- Example:
[
  {"referenceId": "wonOpportunities", "query": "SELECT SUM(Amount) totalAmount FROM Opportunity WHERE IsWon = true"}
]
Pass Input Queries to the Component:
- Use the
inputQueriesattribute of the Gauge Chart component to pass the JSON string of input queries. - The component will execute this query and use the results to populate the chart.
- Use the
Create a Transformation Function:
Define a JavaScript transformation function in a file and upload it as a Static Resource in Salesforce. This function will process the query results and format them for the Gauge Chart.
Example:
/* All functions should be defined within the window.MobeeDynamicFunctions scope in order to work with the Mobee mobile App */

window.MobeeDynamicFunctions = {
  calculateTotalWonAmount: (inputData) => {
    // Represents the input data retrieved by the defined reference
    let wonOpportunities = inputData['wonOpportunities'];
    if (wonOpportunities && wonOpportunities.length) {
      const totalAmount = wonOpportunities[0].totalAmount;
      let gaugeDataItem = {
        actualValue: totalAmount,
        targetValue: 1000000, // Fixed objective amount for comparison (e.g., $1,000,000)
        title: "Total Won Amount",
        subtitle: "Against Sales Target",
      };
      return [gaugeDataItem];
    }
    return [];
  }
}
Upload the JavaScript File as a Static Resource:
- In Salesforce, navigate to Setup.
- In the Quick Find box, type Static Resources and select Static Resources.
- Click New to upload your JavaScript file containing the transformation function.
- Provide a name for the Static Resource (e.g.,
MyMobeeFunctions) and upload the file.
Set the Transformation Function:
- In Mobee Settings, set the
Mobee Dynamic Function File Nameto the name of the Static Resource you created (e.g.,MyMobeeFunctions). - In the field labeled JavaScript Transformation Function Name, enter the name of the function you defined (e.g.,
calculateTotalWonAmount).
- In Mobee Settings, set the